The Network of Organic Chemistry: network statistics, chemistry insights, and AI applications
Published:
Imagine we create a huge, single network of organic chemistry reactions where each unique molecule is represented as a node and molecules that take part in a reaction are connected with directed edges. Such a network would be representative of the current reaction chemistry knowledge. Obviously, some nodes would be highly connected (common/reactive chemicals) than others (rare chemicals); but are there other interesting statistics and properties of this network that could shed some light on how reaction chemistry is structured? If we create such networks at different points in history, how would the statistics evolve over time? Do chemistry networks also exhibit 'small-world' behavior? Can we extrapolate evolution of these properties over time to predict possible future trajectories? Are there any AI applications of such networks apart from merely satisfying scientific curiosity?
To answer these questions accurately and consistently, the network representation has to be right. A directed graph is a natural choice with directed edges between reactant molecules and product molecules for each reaction. However, this is not efficient and introduces suprious edges. We therefore used hypergraphs for this study, a generalization of graphs where each (hyper) edge could connect any number of reactants to products and not just two. We computed statistics of this huge hypergraph of organic chemistry, studied its time evolution, and used random walks on the hypergraph to generate embeddings that are used in reaction classification. We show that the hypergraph representation is flexible, preserves reaction context, and uncovers hidden insights that are otherwise not apparent in a traditional directed graph representation of chemical reactions.
Consider four example reactions (R1, R2, R3, R4) involving five different molecules (A, B, C, D, E). The hypergraph representation for this is shown the figure below. Notice that each hyperedge represents a unique reaction and the annotations indicate the 'role' of a molecule as 'reactant (R)' or 'product (P)'. We create hypergraph networks using a standard reactions dataset containing reactions reported from 1976-2016 with 487,724 reactions in total. We divided the data ino three regimes -- before 1985, 1985-2005, and after 2005, to study the time evolution of various graph-theoretic network statistics.
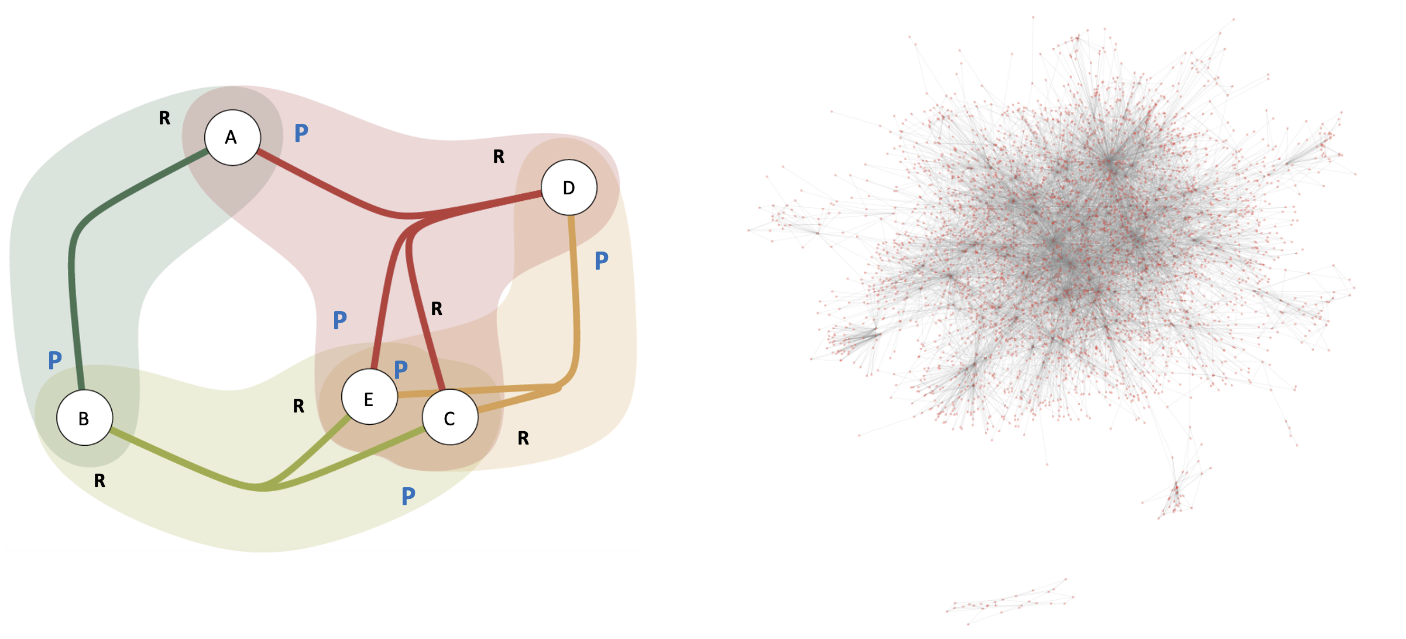
Network statistics and chemistry inferences
Degree distribution: The degree of a node in a graph is its number of incoming or outgoing edges. Degree distributions provide a general sense of the network structure and its connectivity pattern. Generating a degree distribution involves computing the degree (or number of edges) for each node and estimating the underlying probabilistic distribution that they follow. The incoming (product role) degree distribution for the hypergraph for the three time regimes is shown below.
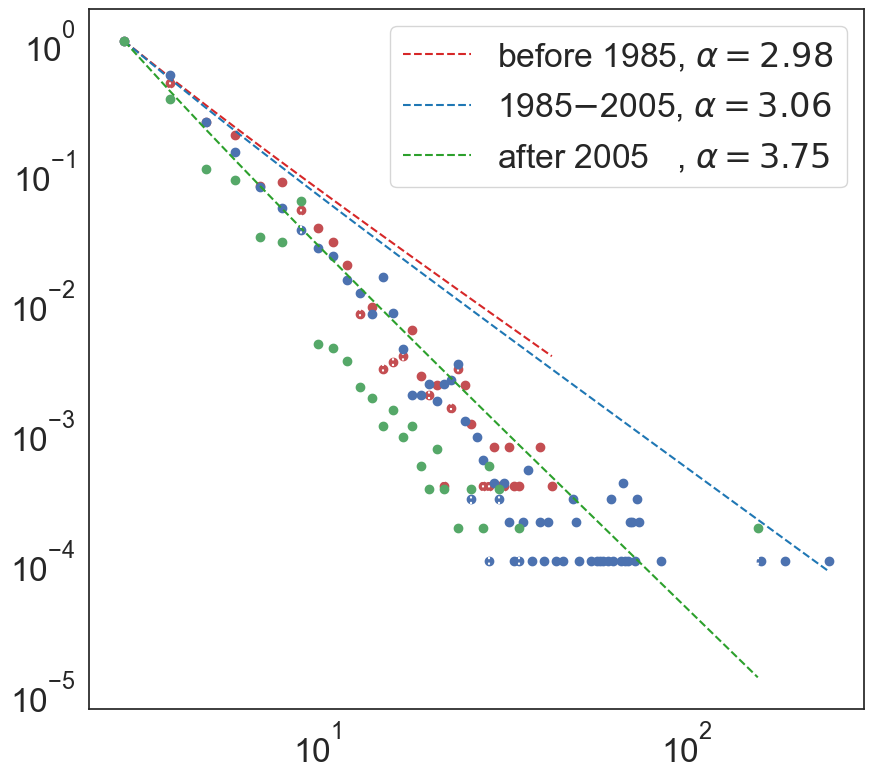
The degree distribution follows a scale-free (or power-law) distribution pointing towards existence of preferential linking meaning new nodes attach to existing nodes with probability proportional to their degree. This implies that chemistry growth is largely driven by a relatively small set of highly important molecules that are highly connected (higher degree, k) and they have a higher likelihood of playing a central role in the discovery of new reactions. The scale-free parameter, alpha, has been increasing over time, indicating towards the accelerated growth nature of chemistry. A high alpha is attributed to higher initial attractiveness, meaning that isolated nodes (new chemicals) have higher non-zero probability of connection. Since the initial attractiveness is the highest and much different in regime 3 (after 2005) than the other two regimes, it could be inferred that in the recent years, there has been an emphasis on the rewiring of existing reactions to create connections between previously disconnected nodes, or the synthesis of rarer molecules -- both possible due to significant advances in computational and experimental chemistry. It becomes clear from the analysis on average shortest path length that the major driver of chemistry evolution in the recent years is the rewiring of existing reactions.
Average path length: The average separation between the molecules (vertices) in terms of number of reactions (edges) is captured by the average path length of the network. We study average path length as a function of the number of nodes in the network using time-based step-forward sampling using 1%, 5%, 10%, 20%, 50% and 100% of the network in each regime. We observe that across both the representations, the average path length between the nodes decreases exponentially as the number of nodes in the networks is increased. Moreover, in both the cases, the average path lengths for the time regimes 1 and 2 are very similar to each other but the average path length for regime 3 is significantly higher than those in other two across all values of N. The phenomenon of decreasing path length as number of nodes is increased has been reported in the literature as network densification where the network grows more and more dense over time.
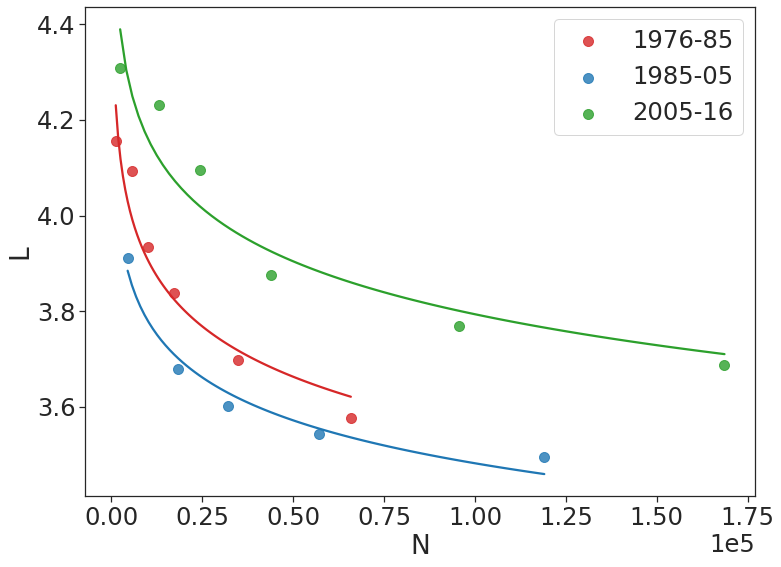
The average all pairs shortest distance for the hypergraph could be interpreted as separation between nodes (or molecules) in terms of number of reaction, since each hyperedge corresponds to a unique reaction and hence, there exists a one-to-one mapping between reactions and hyperedges. We observe that the network of organic chemistry is much more compact than previously understood with nearly 3.25 degrees of separation between molecules, pointing towards an even stronger small-world nature than previously observed with five degrees of separation (based on directed-graph based studies). In addition, in regime 3, we observe a significant upward shift of average separation across all values of N, suggesting that in the recent years, the discovery of complex chemistry has led to the synthesis of molecules via complex routes that has led to a relative increase in their average separation. However, as is evident by the exponentially decreasing average path length as the network grows (higher values of N) across all time regimes, the network exhibits the phenomenon of densification. Network densification takes place primarily due to the creation of links between existing nodes in the network rather than by the addition (or discovery) of new nodes and is characterized by shrinking diameter. Such densification suggests that chemistry has been evolving mostly based on the rewiring of existing reactions (edges) rather than the discovery of completely new molecules (nodes addition), that has brought the molecules closer to each other over time.
Assortativity analysis: Assortativity is a measure of the mixing patterns in networks that indicates the general mixing behavior of nodes with other nodes in the network to give rise to a bigger network. Assortativity is defined as the degree correlations between nodes, and therefore, the mixing pattern could either be assortative (positive correlation) or disassortative (negative correlation). The assortativity is often computed as the Pearson correlation coefficient between the degrees of a pair of nodes and takes values between −1 and 1. A network with an assortativity coefficient of −1 indicates a perfectly disassortative mixing, an assortativity coefficient of 1 points towards a perfectly assortative mixing, and an assortativity coefficient of 0 indicates a non assortative graph.
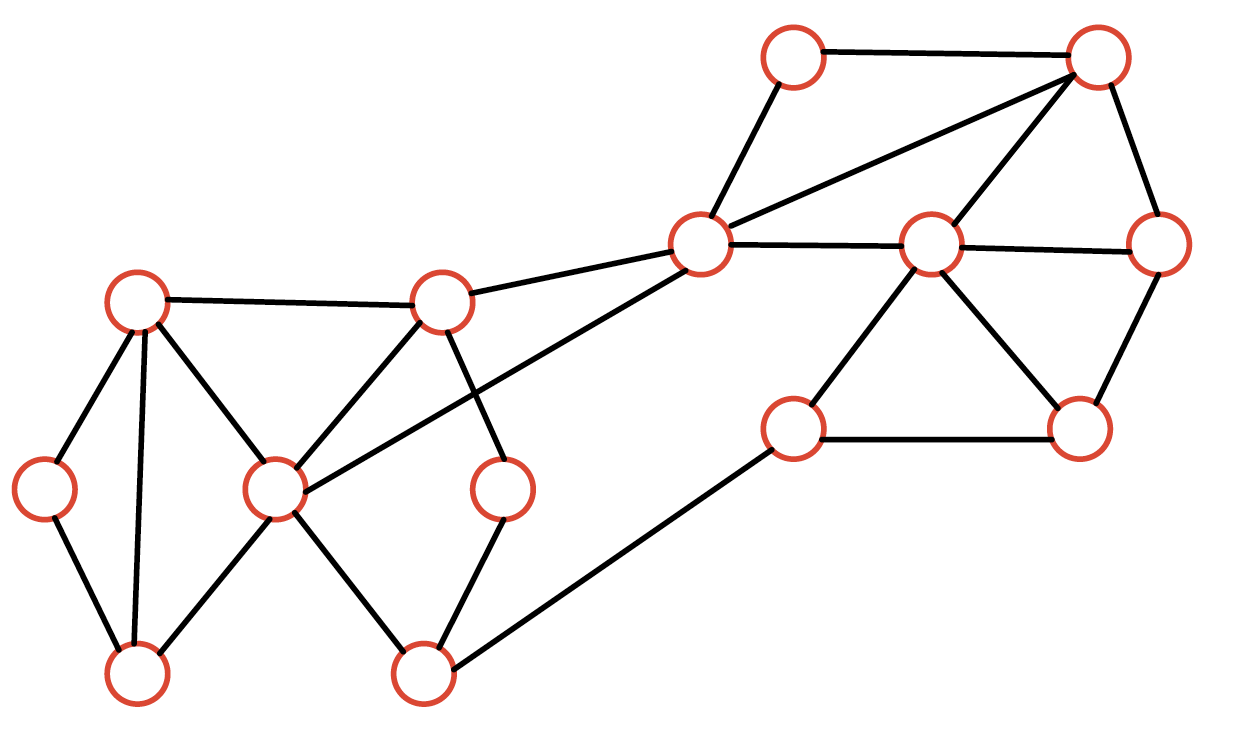
Using the assortativity analysis, we answer questions like -- Do similarly connected products/reactants mix with other similarly connected products/reactants? Do similarly connected heavy/complex molecules mix with similarly connected products/reactants? These questions help us understand the mixing patterns and underlying structure of the network. We observed that the hypergraph network of organic chemistry is assortative with respect to certain node–role pairs such as out–out degree assortativity indicating that commonly used reactants tend to take part in reactions together. Also, reactants were observed to be assortative with molecules of light molecular weight and relatively short/medium SMILES length whereas products were seen to be non-assortative with these properties, thus highlighting the wide spectrum of products with varying degrees of complexity present in the network.
Across time regimes, it is observed that the reactants exhibit assortative mixing (out-out) at nearly the same level across time regimes, whereas the products show a higher but decreasing assortativity (in-in) over time. The assortative behavior between products (in-in) indicates that products of similar degrees are often connected to other products of similar degrees, possible when they themselves are reactants participating in many reactions. This validates the rewiring hypothesis that certain important molecules are both synthesized and take part in important reactions that lead to synthesis of other molecules. This trend has slightly decreasd post regime 1 seen by decreasing assortativity values (possibly due to the synthesis of new products molecules with different chemistry) but is still very signifincant. Moreover, we observe that reactants are assortative/disassortative at the same level with molecular weight and relative molecular complexity across time regimes, with decreasing assortativity as the molecular weight or complexity is increased. Products on the other hand, show a positive assortativity before 1985 with heavy and complex molecules, in regime 2 assortative with medium complexity, and non-assortative in regime 3 with all roles. The latter indicates towards the diversity of products synthesized in the recent years.
Additional analysis based on PageRank to identify the most important molecules and based on community detection (or graph-based clustering) to validate the presence of communities are presented in detail in the published article.
Applications in reaction classification: hyperedge embeddings
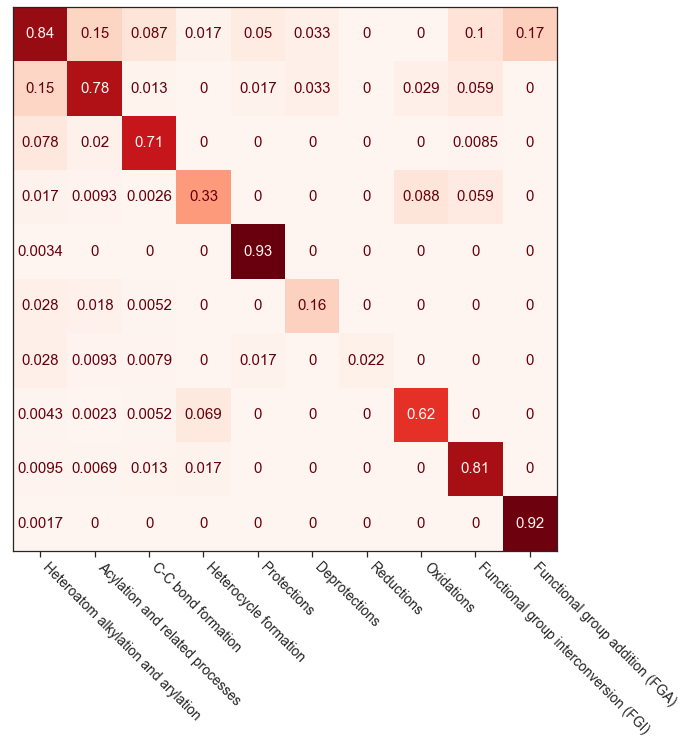
To demonstrate the AI applications of such hypergraphs, we hypothesized based on the community detection analysis that similar reactions are grouped together and the hypergraph embeddings could be used as features to predict the reaction class purely based on their connectivity patterns. To generate these embeddings, we used a random hyperwalk approach to traverse the hypergraph network similar to a random walk. These hyperwalks-based embeddings are used to train a classification model. The precision and recall metrics for the 10 reaction classes are shown below. The pseudocode and details are provided in the published article.

Rigorous statistics and analysis for all the inferences presented could be found in our published article.

